What is Lighthouse performance monitoring?
Google Lighthouse is an open-source tool that audits a web page for performance, accessibility, best practices and SEO. A single audit shows how a page performs today; Lighthouse performance monitoring runs those audits on a regular schedule so you can see trends, spot regressions after a release and prove that optimizations worked. This guide explains what Lighthouse measures, how the performance score is calculated, which Core Web Vitals thresholds apply today – including INP, which replaced FID in 2024 – and how to act on the results.
What Lighthouse measures
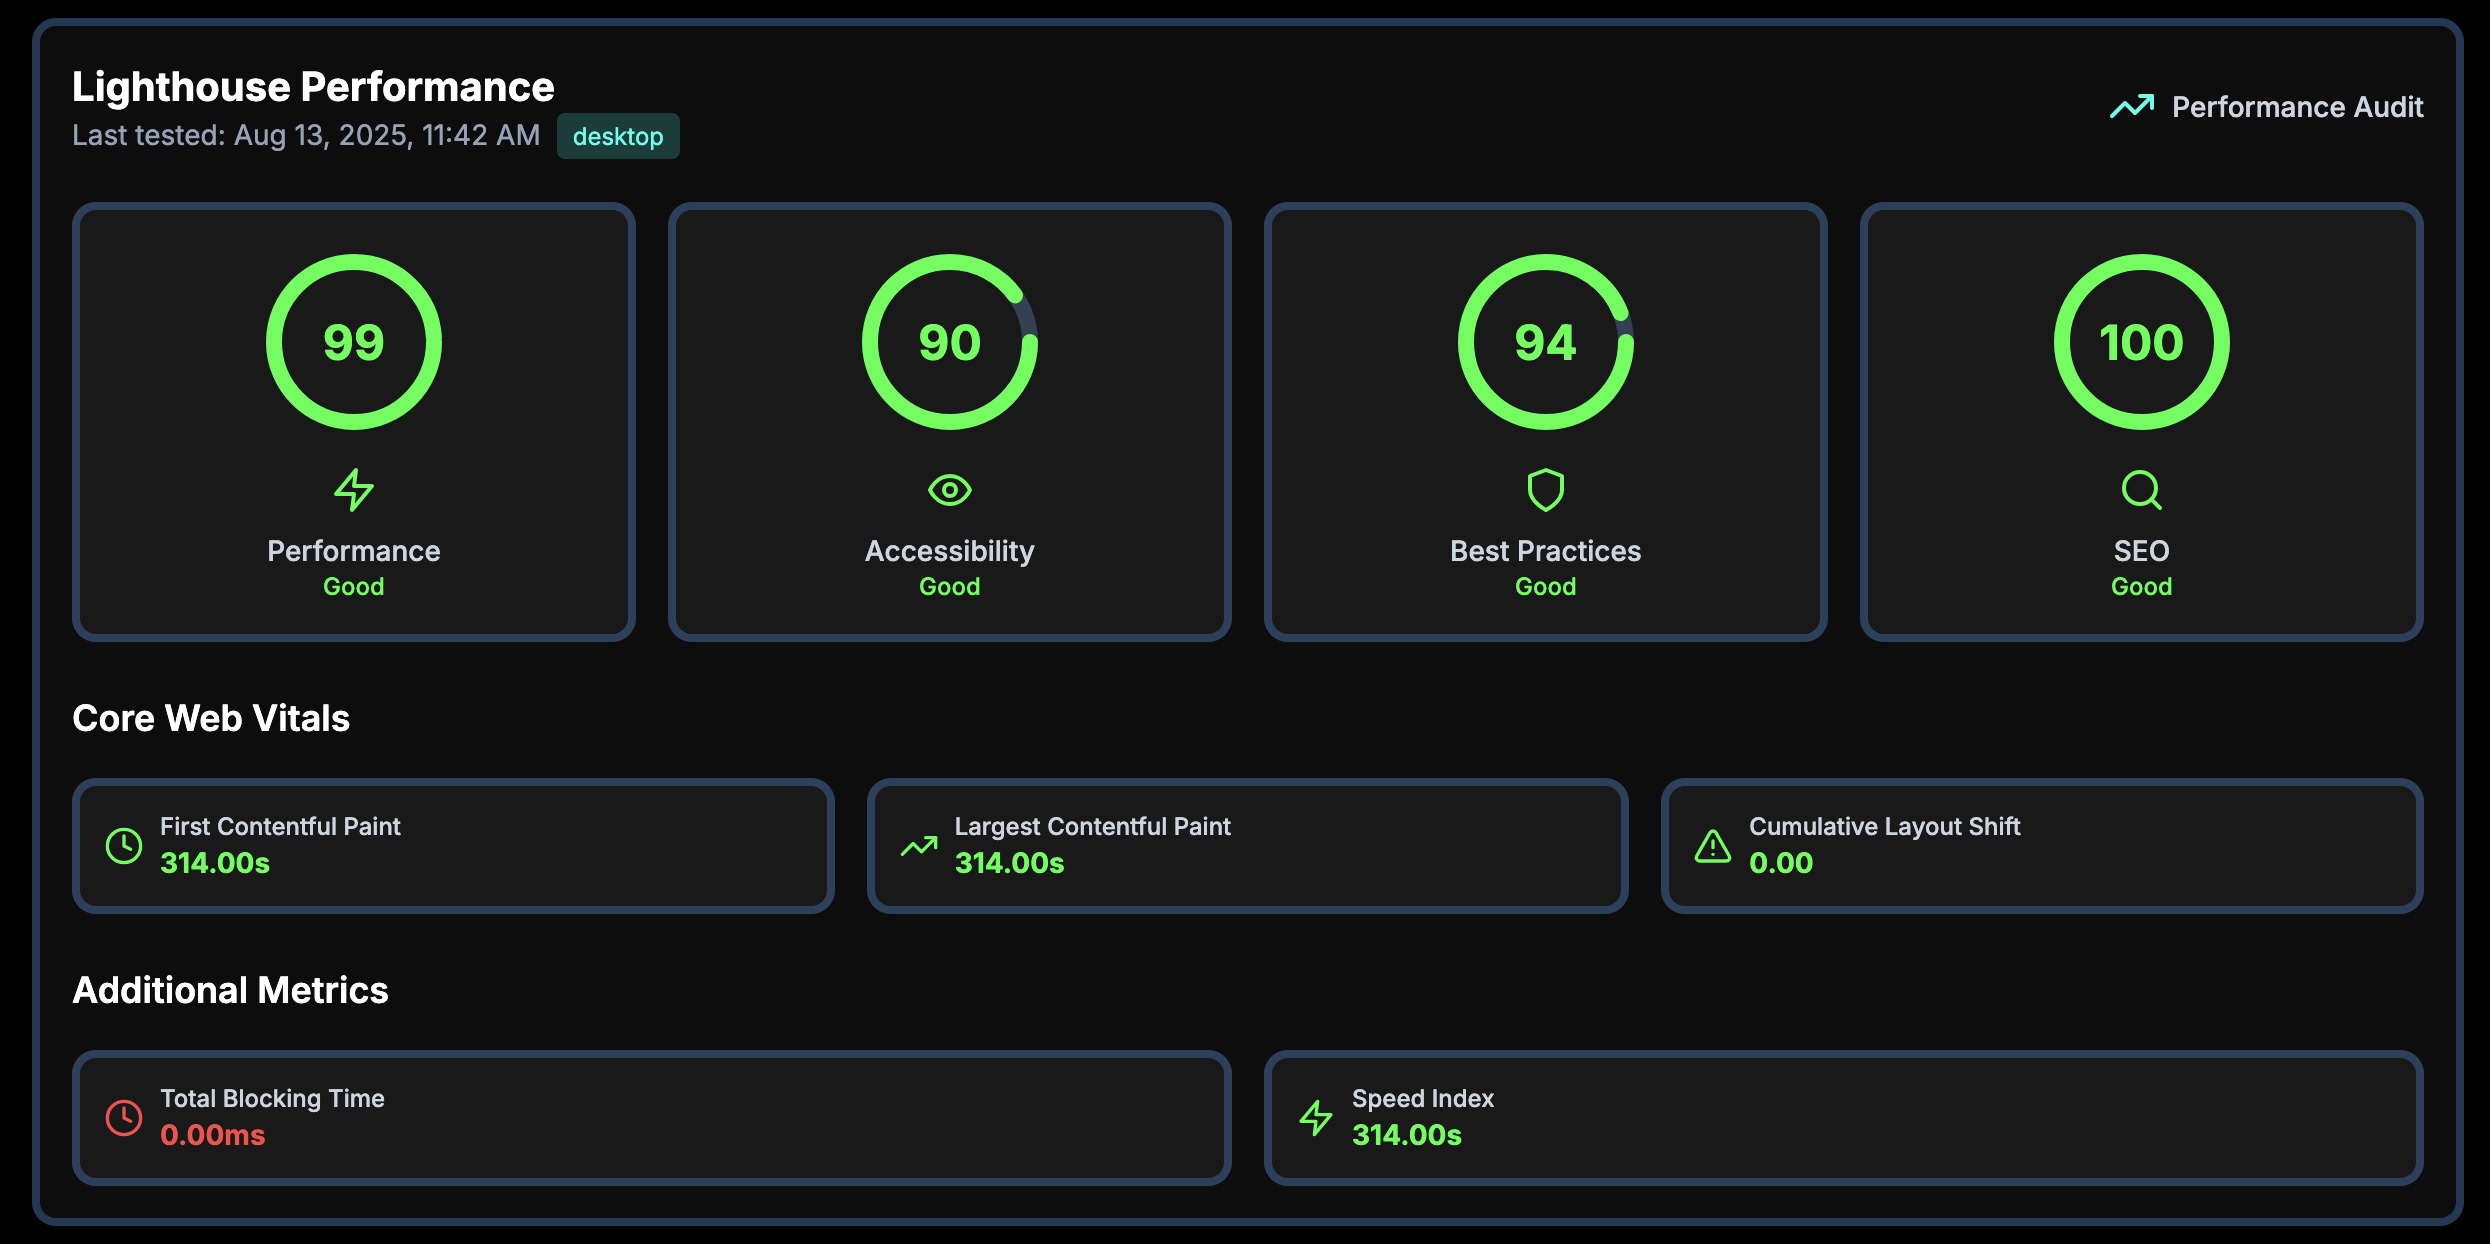
Every Lighthouse report scores a page from 0 to 100 in four categories:
Performance
How quickly the page loads, becomes usable and stays visually stable, based on lab metrics such as Largest Contentful Paint, Total Blocking Time and Cumulative Layout Shift.
Accessibility
Whether people using assistive technology can use the page: color contrast, alt text, form labels, heading order and keyboard navigation.
Best practices
Modern web standards such as HTTPS, no browser errors in the console, secure third-party code and correctly sized images.
SEO
Basic search engine requirements: a title and meta description, crawlable links, valid hreflang and a page that isn't blocked from indexing.
How the Lighthouse performance score is calculated
Since Lighthouse 10, the performance score is a weighted average of five lab metrics. Total Blocking Time and the two Core Web Vitals that Lighthouse can measure carry most of the weight:
- Total Blocking Time (TBT)
- 30%
- Largest Contentful Paint (LCP)
- 25%
- Cumulative Layout Shift (CLS)
- 25%
- First Contentful Paint (FCP)
- 10%
- Speed Index
- 10%
Scores of 90–100 are rated good, 50–89 need improvement and 0–49 are poor. Time to Interactive (TTI) is no longer part of the score.
Scores vary between runs because of network conditions, server load and browser extensions. That's why trends over many runs are more reliable than any single audit.
Core Web Vitals: LCP, INP and CLS
Core Web Vitals are Google's three user-experience metrics for loading, responsiveness and visual stability. Interaction to Next Paint (INP) officially replaced First Input Delay (FID) as the responsiveness metric on March 12, 2024. Google recommends measuring each metric at the 75th percentile of page loads, separately for mobile and desktop.
Largest Contentful Paint (LCP)
Good: 2.5 s or less · Poor: over 4 s
LCP measures how long it takes for the largest image or text block in the viewport to render. It's the best proxy for when users see the main content.
Why it matters: A slow LCP means visitors stare at an incomplete page. Slow server responses, render-blocking resources and large hero images are the usual causes.
How to improve it:
- Reduce server response time (TTFB) with caching and a CDN
- Serve the LCP image in a modern format (WebP or AVIF) at the right size
- Don't lazy-load the LCP image; give it fetchpriority="high"
- Remove or defer render-blocking CSS and JavaScript
Interaction to Next Paint (INP)
Good: 200 ms or less · Poor: over 500 ms
INP measures how quickly the page responds to clicks, taps and key presses throughout the whole visit, and reports one of the slowest interactions. FID only measured the delay before the first interaction was processed.
Why it matters: A poor INP makes a page feel sluggish or broken, even if it loaded quickly. Long JavaScript tasks that block the main thread are the most common cause.
How to improve it:
- Break up long tasks and yield to the main thread
- Reduce and defer third-party scripts
- Keep event handlers small and move heavy work off the main thread
- Avoid large, complex DOM updates after each interaction
Cumulative Layout Shift (CLS)
Good: 0.1 or less · Poor: over 0.25
CLS measures how much visible content moves unexpectedly while the page is open. A shift happens when an element changes position between frames without user input.
Why it matters: Layout shifts make users lose their place or tap the wrong button. They're usually caused by images without dimensions, late-loading ads or embeds, and web fonts.
How to improve it:
- Set width and height (or aspect-ratio) on images, videos and iframes
- Reserve space for ads, embeds and dynamic content
- Don't insert content above existing content unless the user asked for it
- Use font-display and preload key fonts to limit text shifts
Measuring INP with Lighthouse
A standard Lighthouse audit loads the page without interacting with it, so it can't measure INP. Use Total Blocking Time as the lab proxy: a high TBT usually means poor INP for real users. To see actual INP values, check field data from the Chrome UX Report in PageSpeed Insights or the Core Web Vitals report in Google Search Console.
Lab data vs. field data
Lighthouse produces lab data: a controlled test on a simulated device and network. Field data comes from real Chrome users. You need both.
Lab data (Lighthouse)
Repeatable and available immediately, even for pages with little traffic. Ideal for catching regressions before and after a release and for debugging specific problems.
Field data (Chrome UX Report)
Reflects real devices, networks and interactions, and is what Google uses for Core Web Vitals in Search. It's aggregated over the previous 28 days, so changes show up slowly.
Mobile vs. desktop performance
Mobile and desktop results often differ widely, and Google evaluates Core Web Vitals for each separately. Test both.
Mobile
Lighthouse's mobile audit simulates a mid-range phone with a throttled CPU and a slower network. Mobile scores are usually lower and closer to what many real visitors experience.
Desktop
The desktop audit uses a faster simulated connection and no mobile CPU throttling. A good desktop score doesn't mean the mobile experience is good too.
How to improve your Lighthouse performance score
Most gains come from a handful of techniques. Start with whichever area your report flags most:
Critical rendering path
Get the first and largest content on screen faster (FCP, LCP).
Techniques:- Inline critical CSS and defer the rest
- Preload the LCP image and key fonts
- Remove render-blocking JavaScript
- Improve server response time (TTFB)
Images and media
Images are often the largest resources on a page (LCP, CLS).
Techniques:- Use WebP or AVIF with fallbacks
- Serve responsive images with srcset and sizes
- Lazy-load below-the-fold images only
- Always set image dimensions
JavaScript
Less main-thread work means better responsiveness (TBT, INP).
Techniques:- Split bundles and load code on demand
- Remove unused code with tree shaking
- Break up long tasks
- Limit and defer third-party scripts
Network and caching
Deliver every resource faster (all metrics).
Techniques:- Use a CDN close to your users
- Serve over HTTP/2 or HTTP/3
- Set long cache lifetimes for static assets
- Reduce DNS lookups and reuse connections
Common performance problems and fixes
Performance problems tend to follow familiar patterns. Here are three you'll recognize, with the metrics they affect and where to start.
Online shop slows down during a sale
Product pages get heavier and the server slower just when traffic peaks.
- Slow LCP from large, unoptimized product images
- Layout shifts from late-loading banners and reviews
- High TBT from marketing and tracking scripts
Shoppers wait longer, and more of them give up before checkout
- Resize and compress product images and serve WebP or AVIF
- Reserve space for banners and dynamic widgets
- Audit tag managers and defer non-essential scripts
- Cache pages at the edge with a CDN
News site under a traffic spike
A breaking story sends traffic far above normal levels.
- Slow FCP and LCP as the origin server struggles
- Layout shifts from ads and embedded media
- Poor responsiveness from heavy ad scripts
Readers bounce before the article appears
- Serve cached or static versions of article pages
- Reserve fixed slots for ads and embeds
- Load third-party scripts after the main content
- Scale server capacity ahead of expected peaks
Web app gets slower with every release
New features gradually add JavaScript until the app feels sluggish.
- Growing JavaScript bundles
- Long tasks that raise TBT and hurt INP
- More third-party dependencies
Users notice lag in everyday tasks
- Split code by route and load features on demand
- Set a performance budget and check it on every release
- Remove unused dependencies
- Track Lighthouse scores continuously to catch regressions early
Lighthouse performance monitoring with nanokoi.io
nanokoi.io includes Google Lighthouse performance monitoring and Core Web Vitals tracking on every plan, alongside website monitoring for uptime, SSL certificates and DNS.
Automated Lighthouse audits
Instead of running Lighthouse by hand, nanokoi.io audits your monitored URLs for you, so you always have up-to-date performance, accessibility, best-practice and SEO scores.
Core Web Vitals tracking
Track scores and Core Web Vitals over time to see whether a release made things better or worse. Monitoring data can be exported as CSV, JSON or XML for your own analysis.
AI-generated optimization reports
AI-generated optimization reports turn Lighthouse findings into a prioritized list of fixes. The Professional plan adds AI-powered performance insights – see pricing for what each plan includes.
Getting started
You can set up Lighthouse performance monitoring in a few minutes. New to monitoring? Our website monitoring guide covers the basics.
- 1Add your website: Create a free account and add the URLs you want to monitor – the Free plan covers up to 5.
- 2Review your baseline: Check the first Lighthouse scores and Core Web Vitals for each page and note the weakest metric.
- 3Fix the biggest issue first: Work through the AI-generated optimization report, starting with the metric that's furthest from 'good'.
- 4Track the trend: Compare scores after each release to confirm improvements and catch regressions early.
Lighthouse performance monitoring FAQ
What is a good Lighthouse performance score?
90 or above is rated good, 50–89 needs improvement and below 50 is poor. Treat the score as a guide: the individual metrics – especially LCP, TBT and CLS – tell you what to fix.
Does Lighthouse still measure FID?
No. FID was retired as a Core Web Vital in March 2024 and replaced by INP. Lighthouse can't measure INP in a standard page-load audit, so it reports Total Blocking Time as a lab proxy.
Why do my Lighthouse scores change between runs?
Network conditions, server load, CPU availability and browser extensions all affect lab results. Monitoring over time smooths out this noise and shows the real trend.
Do Lighthouse scores affect Google rankings?
Not directly. Google's ranking systems use Core Web Vitals from real-user field data as part of page experience, not the Lighthouse score itself. Lighthouse helps you find and fix the problems that affect those metrics.
Start monitoring your Lighthouse performance
Track Lighthouse scores and Core Web Vitals for your key pages and get AI-generated optimization reports. The Free plan covers up to 5 URLs.
Start monitoring for freeNo credit card required