Every Monitoring Signal, One Unified Dashboard
Modern web teams juggle multiple tools — uptime alerts here, Core Web Vitals there, DNS dashboards somewhere else. Nanokoi brings every layer into one real-time view so you can stop tab-hopping and start solving issues faster.
From synthetic availability checks to Lighthouse performance runs and AI-written incident summaries, each monitoring pillar feeds the same automation, alerts, and reporting workflows.
Six Monitoring Pillars That Work Together
Global Uptime Monitoring
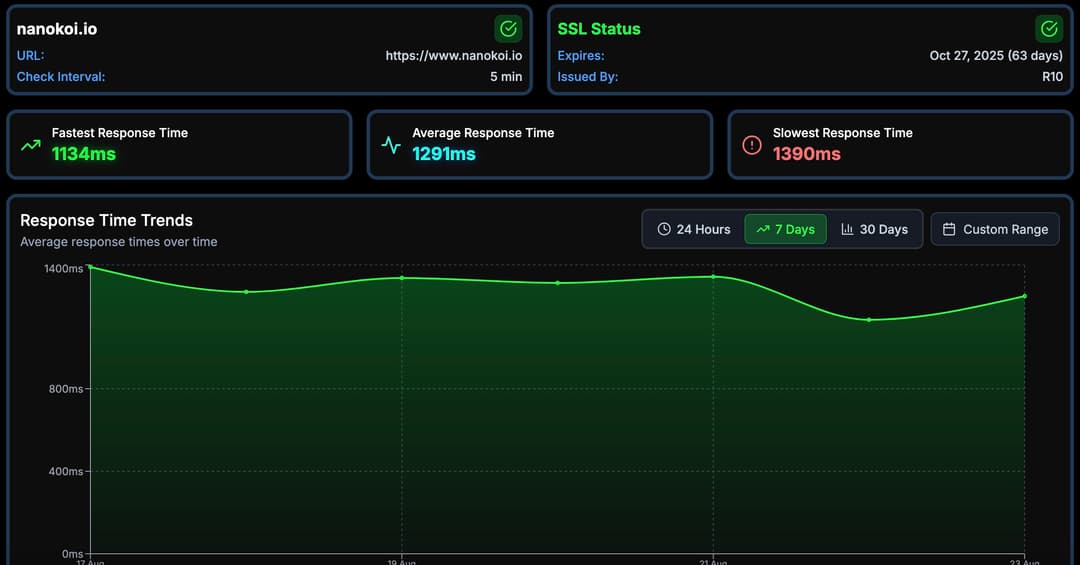
Multi-region checks, SLA tracking, public status pages, and instant alert routing keep outages from becoming surprises.
Performance & Lighthouse Analytics
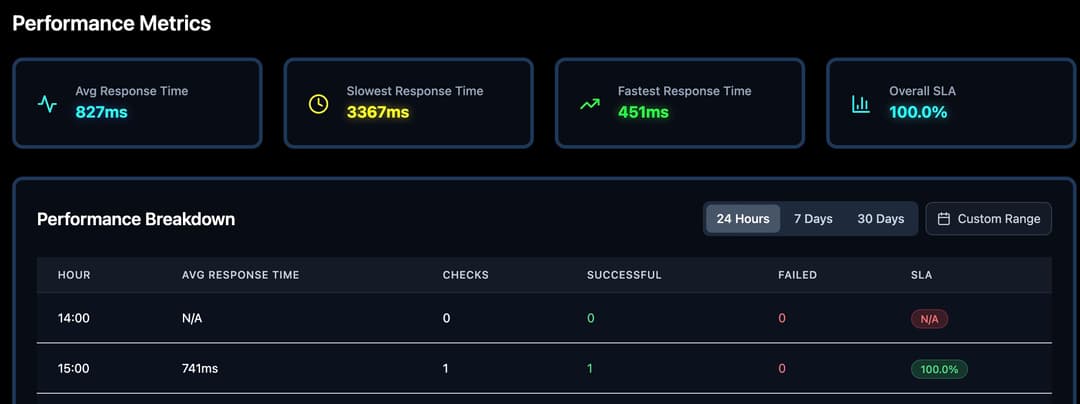
Scheduled Core Web Vitals audits, Lighthouse benchmarking, and anomaly alerts highlight regressions before users notice.
DNS & Certificate Assurance
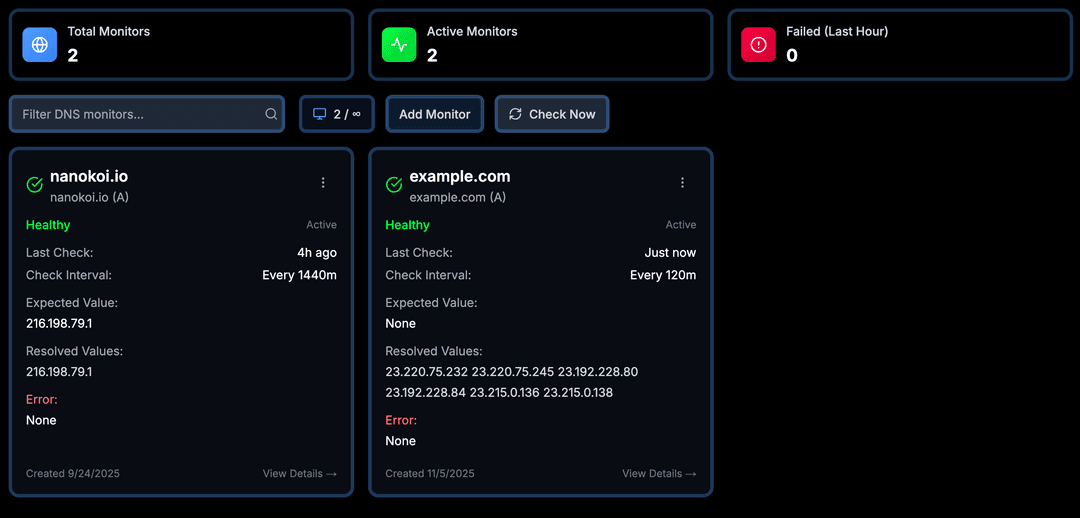
Proactive DNS changes, WHOIS expiration, and certificate health monitoring guarantee that critical records never drift.
Nanokoi Monitoring Coverage At a Glance
Uptime, performance, incident response, and reporting share the same workspace and alerting stack.
| Capability | What it monitors | Nanokoi advantage |
|---|---|---|
| Uptime & SLA | HTTP/S availability, regional latency, historical SLOs | Global checks, runbooks, SLA exports, public status sites |
| Synthetic Journeys | Checkout flows, auth paths, multi-step APIs | Headless browser monitors with screenshots and session replays |
| Performance & Lighthouse | Core Web Vitals, Lighthouse scores, bundle weight | Automated Lighthouse runs, trend diffing, regression alerts |
| Real User Analytics | Device, network, location insights, long tasks | Lightweight script, AI summaries, conversion correlation |
| DNS & SSL | Record drift, DNSSEC, certificate expiry, WHOIS | Change history, alerting, single-click verification checks |
| Incident Automation | Pager duty, Slack, email, webhook playbooks | AI-written summaries, root-cause hints, follow-up tasks |
Every signal is normalized through shared alert policies, AI summaries, and collaborative incident timelines.
How Teams Use the Suite Day to Day
- 1
Start each morning with the Nanokoi command center: uptime map, Lighthouse deltas, and DNS health badges.
- 2
Get alerted in Slack with context-rich payloads that include AI-generated summaries, suggested fixes, and related incidents.
- 3
Review automated status-page updates and SLA reporting without copying data between tools.
- 4
Share unified dashboards with engineering, product, and leadership for proactive planning.
Automation That Keeps Learning
Nanokoi AI watches every incident timeline, capturing context and tagging contributing monitors so future alerts come with answers, not homework.
Continuous Lighthouse and DNS snapshots feed the same metadata, letting the AI correlate performance drops with configuration changes or traffic spikes.
Complete Peace of Mind for Modern Ops Teams
By merging uptime, performance, Lighthouse, DNS, SLA reporting, and AI automation, Nanokoi replaces a patchwork of disconnected dashboards.
Your users see faster pages, your stakeholders get clearer reports, and your engineers reclaim the time they used to spend stitching together alerts.
See the Monitoring Suite in Action
Dashboards, performance insights, and DNS assurance live side by side to give teams the full story.
Ready to unify your monitoring?
Give your team the confidence that every part of your stack is covered—from uptime to Lighthouse to DNS—without juggling six different tools.